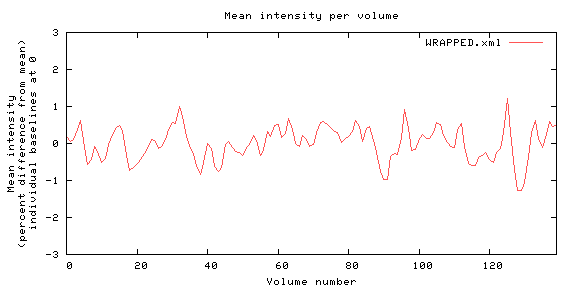
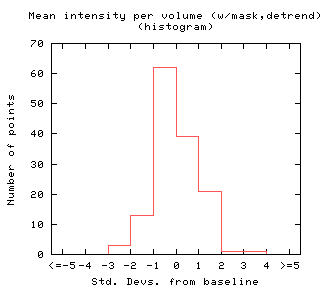
Volume means: this metric tracks the mean intensity of each volume (time point) in the data. Increases and decreases in overall brain activity will be reflected in this plot. RF spikes and other acquisition artifacts may be visible here (esp. if they affect an entire volume).
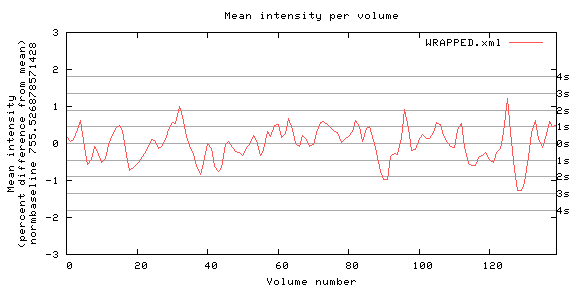
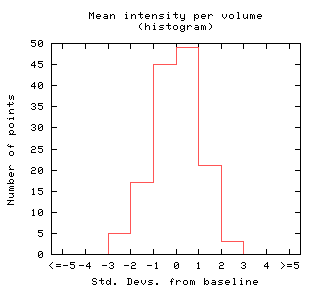
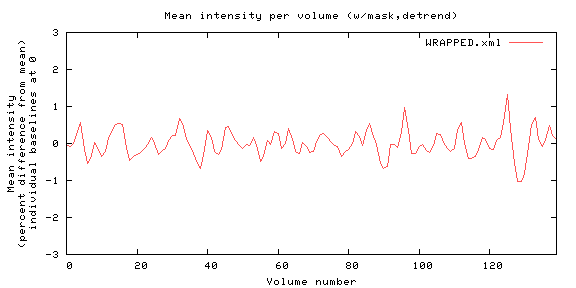
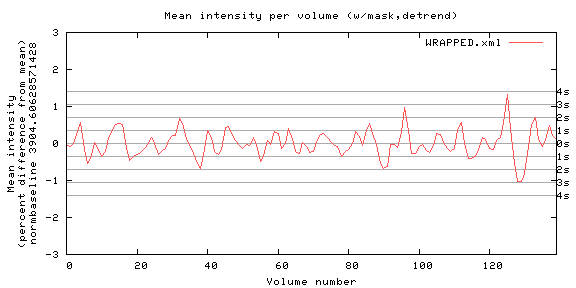
Masked, detrended volume means: this is the volume means metric applied to masked and detrended data.
Volume means: this metric tracks the mean intensity of each volume (time point) in the data. Increases and decreases in overall brain activity will be reflected in this plot. RF spikes and other acquisition artifacts may be visible here (esp. if they affect an entire volume).
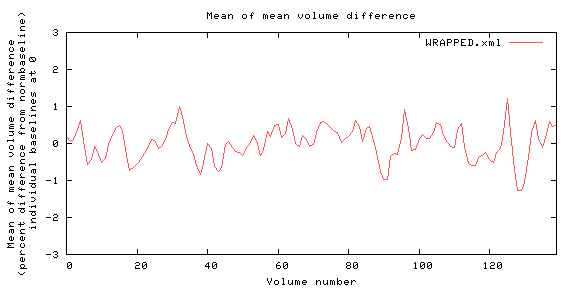
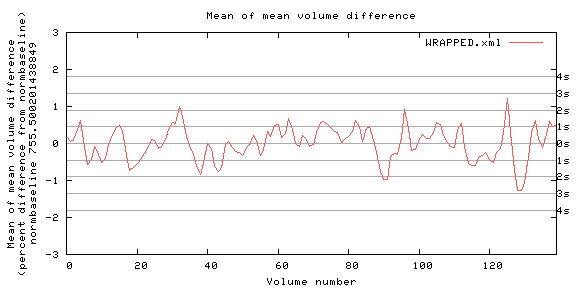
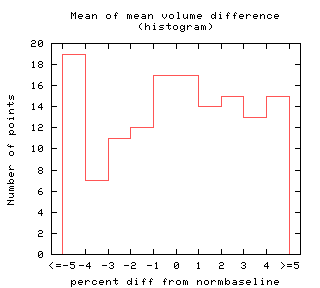
Means of mean volume difference: for each volume vol and a mean volume meanvol, this metric tracks the mean intensity of (vol - meanvol). Slow drifts in the input data will be apparent in this plot.
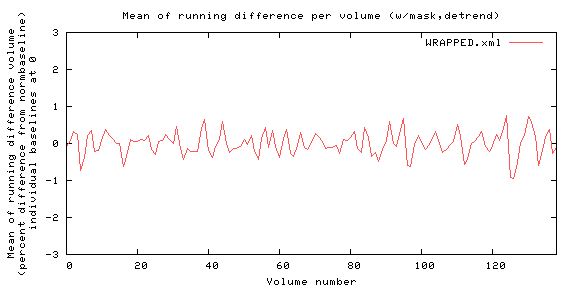
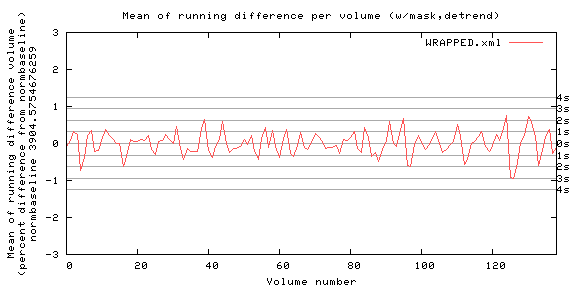
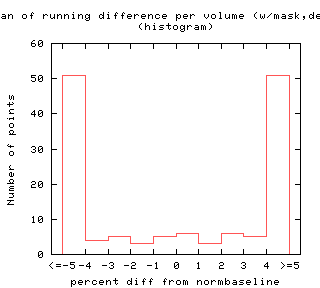
Running difference ("velocity") volume means (w/ mask,detrend):(What’s this?)
Masked, detrended running difference ("velocity"): this metric tracks the change in the mean intensity of consecutive volumes by subtracting the mean intensity of each volume from the mean intensity of its subsequent volume.
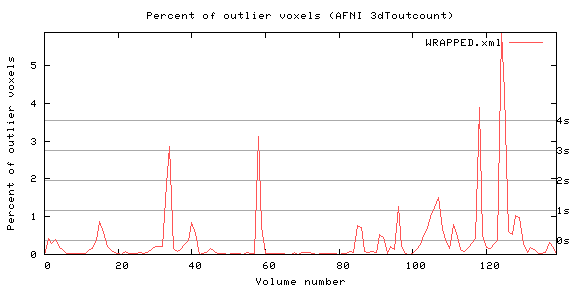
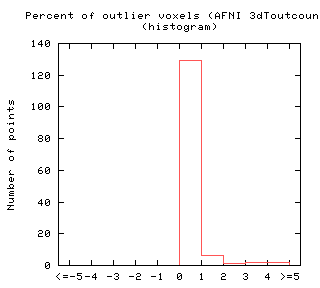
Outlier voxel percentages: this metric is calculated by running the detrended data through the AFNI program 3dToutcount. This metric shows the percentage of "outlier" voxels in each volume. For a definition of "outlier", see the documentation for 3dToutcount on the AFNI web site, or run 3dToutcount without arguments.
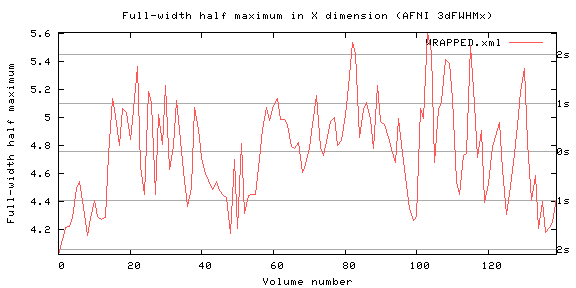
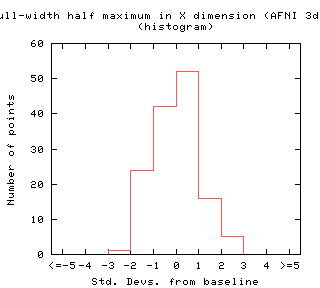
FWHM in X dimension (from AFNI's 3dFWHMx) (w/ mask):(What’s this?)
Full-width half-maximum (FWHM): this metric shows the estimated FWHM for each volume in X, Y, or Z directions, used as a measure of the "smoothness" of the data.
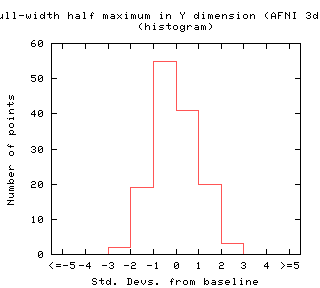
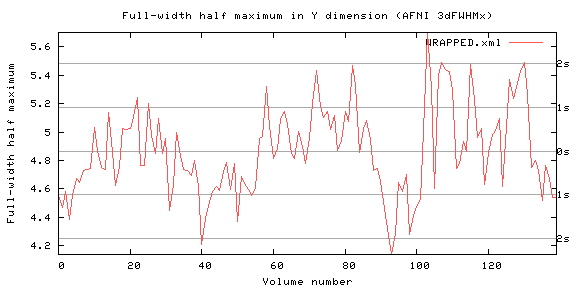
FWHM in Y dimension (from AFNI's 3dFWHMx) (w/ mask):(What’s this?)
Full-width half-maximum (FWHM): this metric shows the estimated FWHM for each volume in X, Y, or Z directions, used as a measure of the "smoothness" of the data.
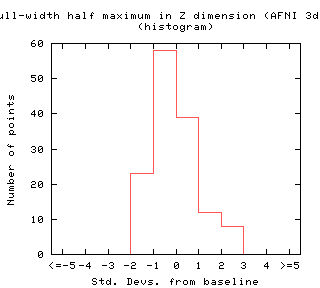
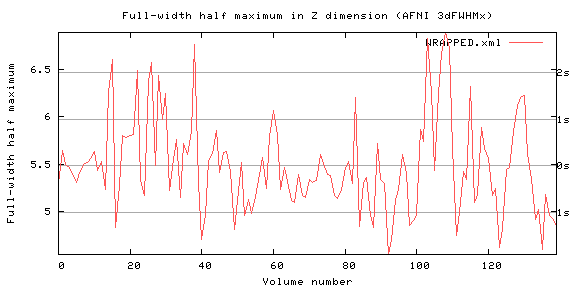
FWHM in Z dimension (from AFNI's 3dFWHMx) (w/ mask):(What’s this?)
Full-width half-maximum (FWHM): this metric shows the estimated FWHM for each volume in X, Y, or Z directions, used as a measure of the "smoothness" of the data.
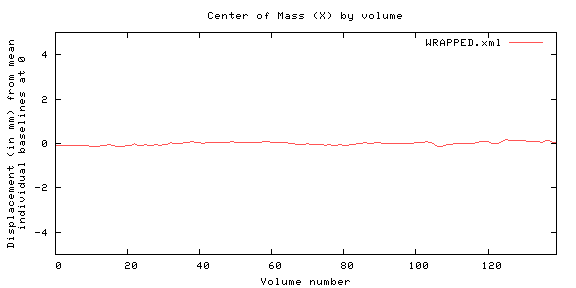
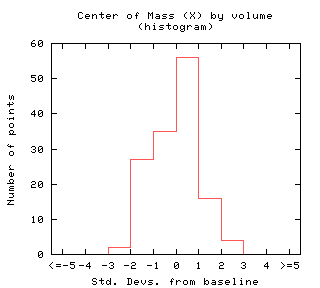
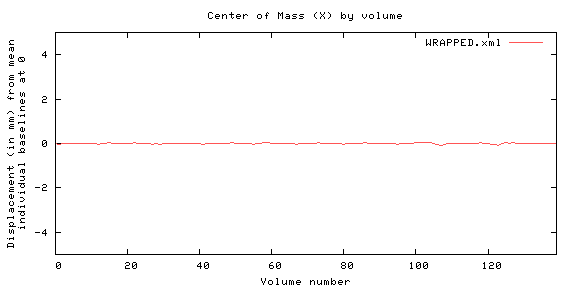
Center of mass: this metric is calculated as a weighted average of voxel intensities, where each voxel is weighted by its coordinate index in the X, Y, or Z direction. Head motion in each of the three directions may be reflected as a change in this metric.
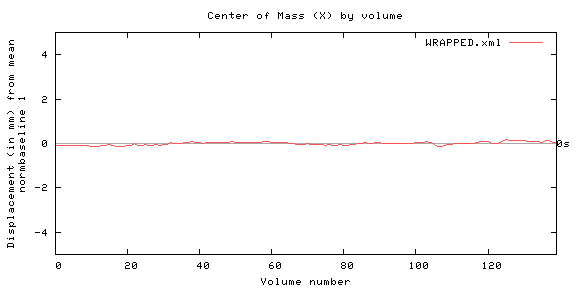
Masked, detrended center of mass: this is the center of mass metric applied to masked and detrended data. Thus this metric will be insensitive to noise outside the mask.
Center of mass: this metric is calculated as a weighted average of voxel intensities, where each voxel is weighted by its coordinate index in the X, Y, or Z direction. Head motion in each of the three directions may be reflected as a change in this metric.
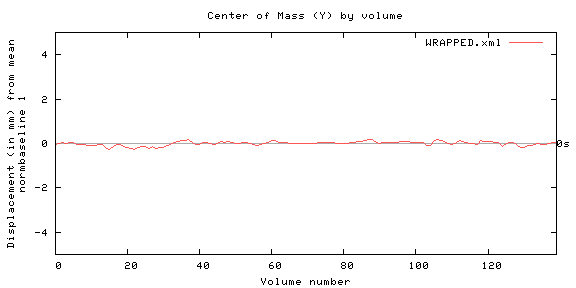
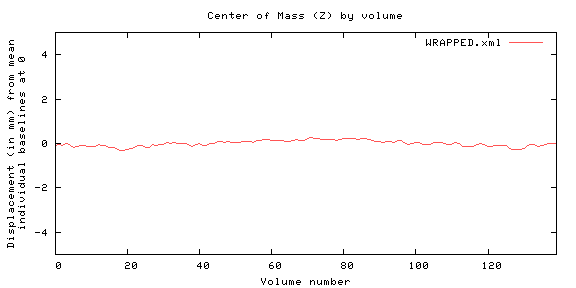
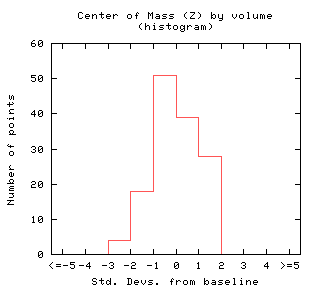
Center of mass: this metric is calculated as a weighted average of voxel intensities, where each voxel is weighted by its coordinate index in the X, Y, or Z direction. Head motion in each of the three directions may be reflected as a change in this metric.
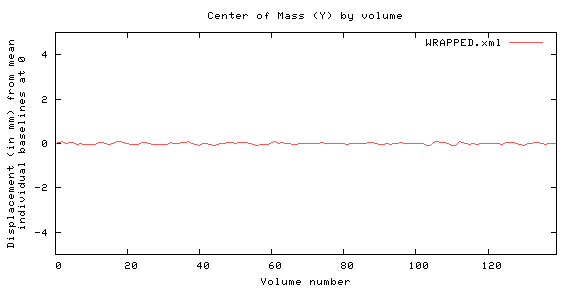
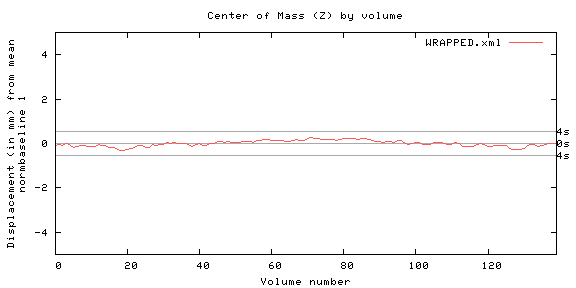
Masked, detrended center of mass: this is the center of mass metric applied to masked and detrended data. Thus this metric will be insensitive to noise outside the mask.
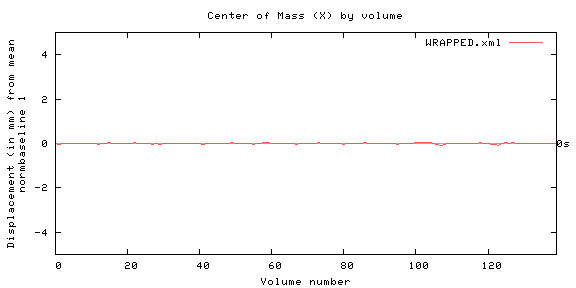
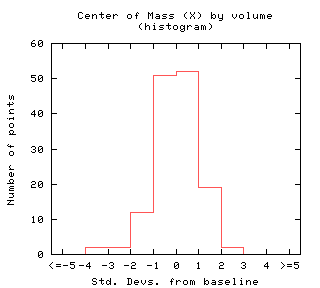
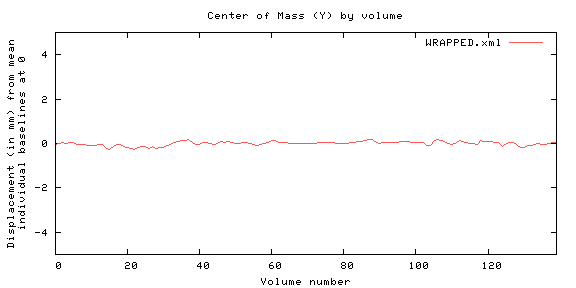
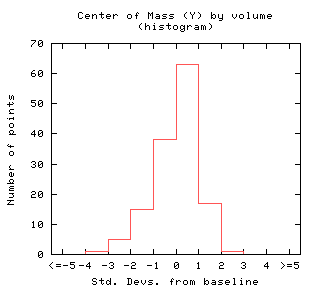
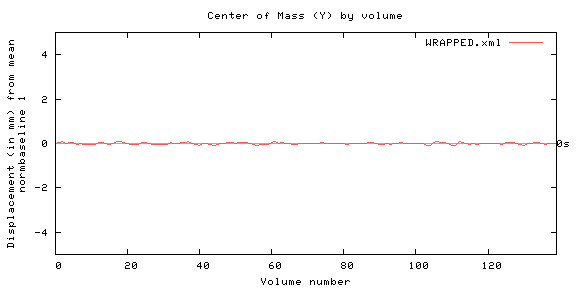
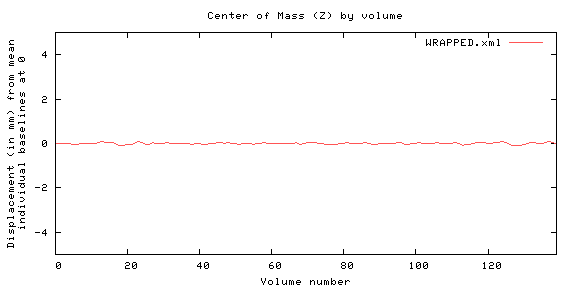
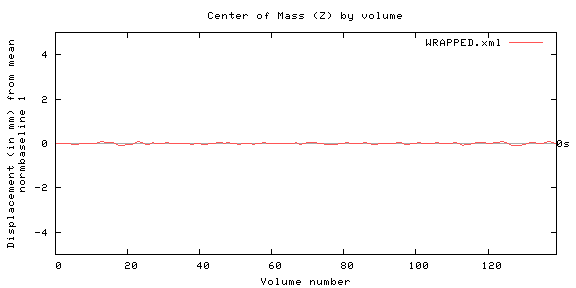
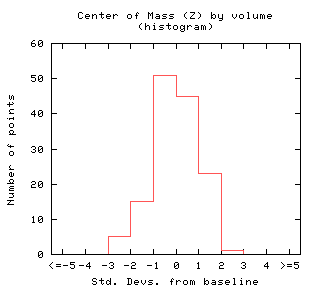
Center of mass: this metric is calculated as a weighted average of voxel intensities, where each voxel is weighted by its coordinate index in the X, Y, or Z direction. Head motion in each of the three directions may be reflected as a change in this metric.
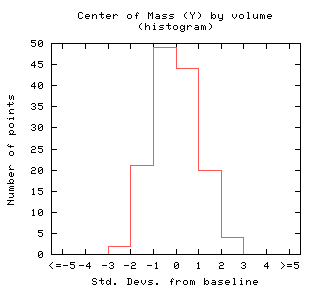
Center of mass: this metric is calculated as a weighted average of voxel intensities, where each voxel is weighted by its coordinate index in the X, Y, or Z direction. Head motion in each of the three directions may be reflected as a change in this metric.
Masked, detrended center of mass: this is the center of mass metric applied to masked and detrended data. Thus this metric will be insensitive to noise outside the mask.
Center of mass: this metric is calculated as a weighted average of voxel intensities, where each voxel is weighted by its coordinate index in the X, Y, or Z direction. Head motion in each of the three directions may be reflected as a change in this metric.
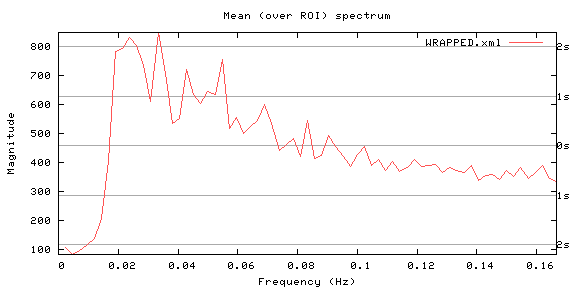
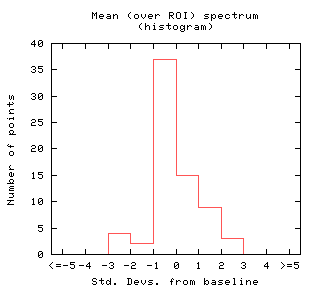
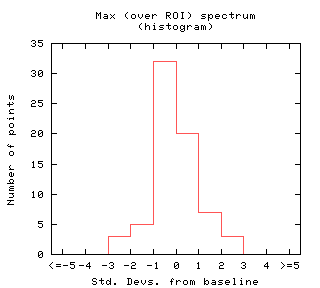
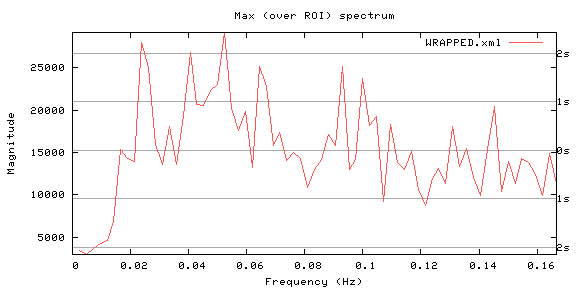
Frequency spectrum (max over mask) (w/ mask,detrend):(What’s this?)
Spectrum max: a frequency spectrum is calculated for each voxel in the mask and this plot shows the maximum power for each frequency across all voxels.
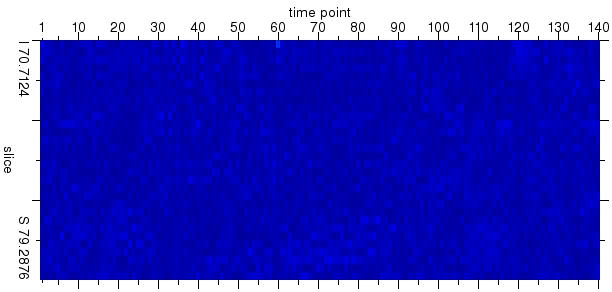
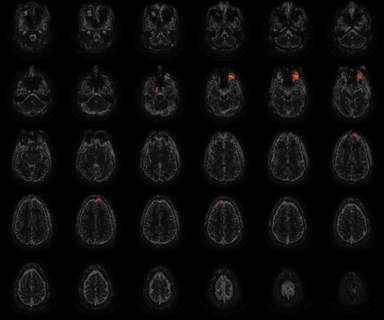
Per-slice variation: this image shows, for each slice at each time point in the data, a measure of "spikiness" at slice granularity that is insensitive to artifacts that affect all slices (e.g. head motion). Higher numbers indicate a "spike". It is computed as follows:
For each voxel remove the mean and detrend across time.
Calculate the absolute value of the z-score across time for each voxel.
For each slice at each time point, compute the average of this absolute z-score over all voxels in the single slice, producing a Z*T matrix AAZ.
For each slice at each time point, calculate the absolute value of the "jackknife" z-score of AAZ across all slices at that time point, producing a new Z*T matrix JKZ, which is the per-slice variation. (To compute a "jackknife" z-score, use all slices except the current slice to calculate mean and standard deviation. The jackknife has the effect of amplifying outlier slices.)
Douglas N. Greve, Nathan S. White, Syam Gadde, FIRST-BIRN. "Automatic Spike Detection for fMRI." Poster. Organization for Human Brain Mapping Annual Meeting, Florence IT 2006.
Standard deviation: this is the volume composed of the standard deviation of each voxel across time. The colorbar goes from 0 to 0.3 * the maximum intensity range of the mean volume.
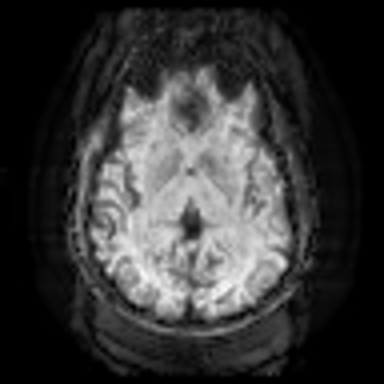
Signal-to-Fluctuation Noise Ratio (SFNR): this is a signal-to-noise (SNR) measure calculated for each brain voxel in the middle slice. It is essentially the average across time divided by standard deviation (of detrended signal) across time.
Friedman L, Glover GH, The FBIRN Consortium. "Reducing interscanner variability of activation in a multicenter fMRI study: Controlling for signal-to-fluctuation-noise-ratio (SFNR) differences." Neuroimage. September 2, 2006.
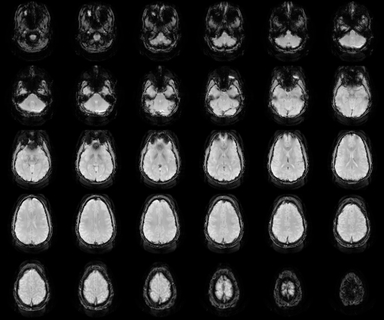
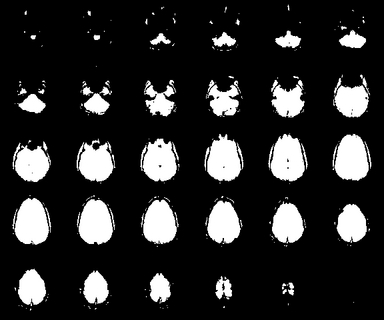
Mask: this mask is generated by creating a histogram of voxel intensities, fitting a curve to the histogram, and choosing the first local minimum of the curve as a threshhold. The assumption of this algorithm is that the data will exhibit two "humps" in the histogram, the first being noise, and the second being actual brain signal.